0:20
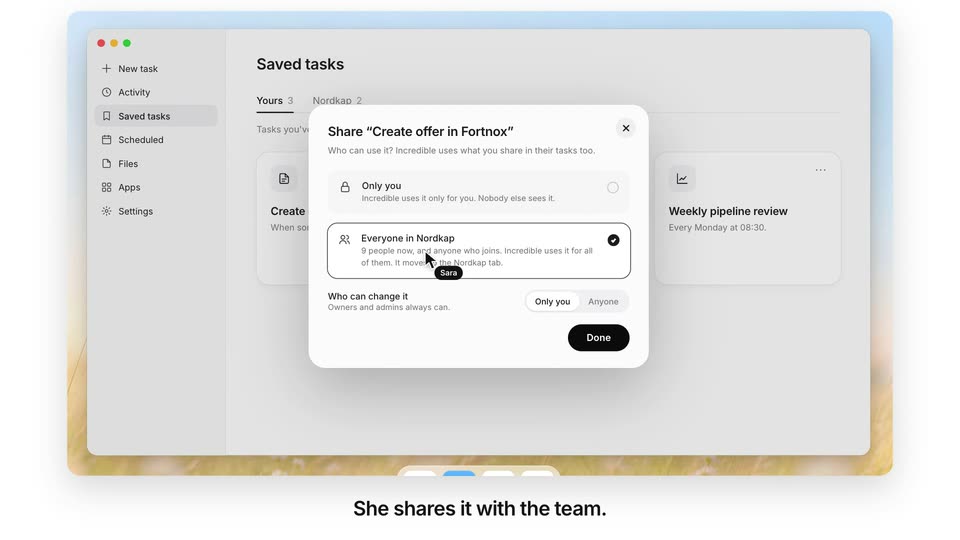
Incredible - We just launched Incredible for teams. One person shows Incredible h
Incredible · Nov 2026
Netlify · Mar 2024 · 0:31 · AI-annotated
Netlify’s 0:31 launch film runs 13 scenes, about 2.4 s each. The product shows up at 0:06 and 1 feature is revealed. There is no explicit call to action. The video runs one tight arc: a red Failed badge, a click on the mint “Why did it fail?” pill, an AI diagnosis, a code fix, and an all-green deploy log. It is cut on fast reframes and zooms between console, panel and editor, with teal highlight bars and flipping status pills as its signature moves.
Is this your launch? to your site or press kit.
Incredible · Nov 2026
Webflow · Design · Aug 2015
A dark blue terminal log with line numbers and timestamps fills the frame. A mint-green rounded pill sits centered, holding a terminal icon, the words “Why did it fail?” and a small AI badge, with a white cursor at its lower right edge. The shot holds still.
Techniques: Cursor demo
Camera: Static
A white deploy log panel lists five steps in a vertical stack. Status badges update in sequence: Initializing flips to a green Complete badge, Building turns to a red Failed badge, and the remaining rows switch to gray Skipped badges.
Camera: Push in
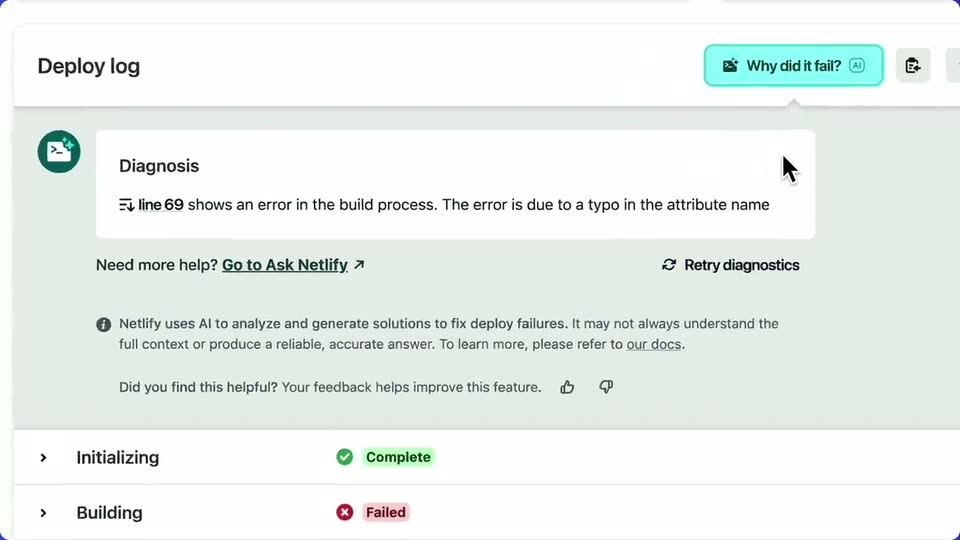
A close-up of a teal “Why did it fail?” AI button reframes out to reveal a deploy log list with Complete, Failed and Skipped status pills. A cursor hovers and clicks the button, opening an AI diagnosis panel that loads, then fills with Diagnosis and Solution text.
Techniques: UI zoom, Cursor demo
Camera: Push in
A static deploy log view displays a Diagnosis and Solution card explaining a build typo, with a small green terminal icon at left. A mouse cursor drifts across the body text from right to left.
Techniques: Cursor demo
Camera: Static
A close-up of a white AI answer panel on a pale gray background, with a teal “Why did it fail?” pill at the top right. A teal highlight bar grows left to right across the typo sentence as a text caret tracks its edge.
Camera: Static
A close-up of a diagnostic message on a white panel. A cyan highlight marks a phrase at the top, while the word “decription” in the body pulses from gray to cyan. A “Retry diagnostics” button with a refresh icon sits at the bottom right.
Camera: Static
A dark code editor fills the frame in close-up. An I-beam cursor rests at a highlighted attribute on a line of syntax-colored code. The line then shifts into overlapping ghost characters, as if typed at high speed.
Techniques: Cursor demo
Camera: Static
A dark source-control panel of a code editor fills the frame. A white cursor arrow glides up from the staged file row and hovers over the blue Commit button.
Techniques: Cursor demo
Camera: Static
A wide view of the Netlify dashboard reframes and zooms in on the Deploy log list, where five steps each carry a green Complete badge. A cursor hovers near the header.
Techniques: UI zoom
Camera: Push in
A white deploy log panel lists five steps, each with a green check and a Complete pill. A cursor travels down the rows and exits to the bottom right.
Techniques: Cursor demo
Camera: Static
The Netlify deploy page scrolls up to bring the published deploy card to the top. A cursor drifts to the left sidebar and hovers over Domain management while the word Published is highlighted in teal.
Techniques: Cursor demo
Camera: Static
A white Netlify dashboard panel slides down to reveal a blue log console behind it, as a light green pill reading “Why did it fail?” with a circular AI icon slides in and a cursor points at it.
On-screen text: “Why did it fail?”
Techniques: Cursor demo
Camera: Pan
A blue log list fills the frame in monospace type. A mint rounded button with a terminal icon, the words Why did it fail?, and an AI badge sits over lines 93 to 94. A white cursor points at the button's lower right.
Camera: Static