2:30

Item Launch Video (YC F25) | Unveil Studio
Item · Oct 2026
Amplitude · Jun 2020 · 1:56 · AI-annotated
Amplitude’s 1:56 launch film runs 25 scenes, about 4.7 s each. The product is on screen from the first frame and 3 features are revealed, with social proof. The call to action lands at 1:40 (86% in). A feature launch built as a question and answer loop: locked-off indigo text cards pose a question line by line, then a cursor-driven screen recording of the Amplitude UI answers it, cycling through the Historical Count property, Pathfinder, and funnel conversion drivers. The style is calm and even, with slow crossfades between cards and interfaces, a pale lavender geometric frame on every card, and bolded keywords as the recurring emphasis device.
Is this your launch? to your site or press kit.
Item · Oct 2026
Anthropic · AI · Oct 2025
A small blue dot grows into the Amplitude circle as the white wave glyph draws itself in. The blue wordmark Amplitude appears to the right, the lockup holds centered, then fades to a white background with faint dot grids and a thin curve.
On-screen text: “Amplitude”
Camera: Static
A pale lavender frame with corner dot grids and a wavy line holds indigo text that builds line by line, key phrases in bold. The question fades out, then three example moments appear in turn as a product Events list fades in behind them.
On-screen text: “Do you know the moments when users fall in love with your product?”, “Like finishing their 1st workout, purchasing their 2nd song, or inviting their 3rd teammate?”
Techniques: Kinetic type
Camera: Static
A product interface fades in under a large lavender caption, which then fades out. The Events list fills in as a 'where Historical Count' condition appears under each row in sequence, and the screen fades to white.
On-screen text: “Like finishing their 1st workout, purchasing their 2nd song, or inviting their 3rd teammate?”
Camera: Static
On a plain off-white card framed by lavender dot grids and a thin wavy line, two centered indigo text blocks fade in line by line, the first stating product teams think about milestones, the second explaining why analyzing them matters.
On-screen text: “Most product teams think”, “about these moments, or milestones,”, “but fail to analyze them.”, “If you can't analyze milestones,”, “you don't know how to make”, “more new users become”, “high-value customers.”
Techniques: Kinetic type
Camera: Static
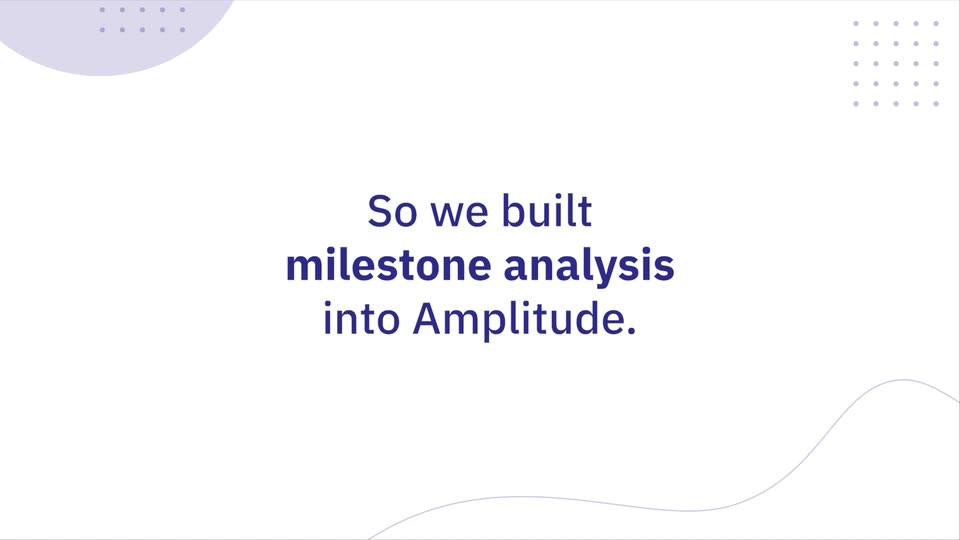
A centered lavender text block on a pale background reads the problem statement, framed by dot grids in the corners and a thin curve below. It then cuts to a second centered block stating the solution. The frame stays locked off throughout.
On-screen text: “If you can't analyze milestones,”, “you don't know how to make”, “more new users become”, “high-value customers.”, “So we built”, “milestone analysis”, “into Amplitude.”
Camera: Static
A white card holds a centered three-line statement in indigo sans-serif, the middle line in bold. A pale lavender quarter-circle with a dot grid sits top-left, a dot grid top-right, and a thin wavy line curves along the bottom. The frame stays static throughout.
On-screen text: “So we built”, “milestone analysis”, “into Amplitude.”
Camera: Static
A white card with purple dot grids and a thin wavy line holds centered purple text that swaps from one statement to the next on a locked-off frame.
On-screen text: “So we built milestone analysis into Amplitude.”, “So you can accurately answer questions like:”
Camera: Static
A white slide with lavender dot accents holds the line “So you can accurately answer questions like:”, which crossfades to a quoted question, “1st song purchase” in bold. The question fades out as the analytics dashboard fades in.
On-screen text: “So you can accurately answer questions like:”, ““How many users made their 1st song purchase last week?””
Camera: Static
A cursor works through an analytics dashboard, opening a property dropdown, choosing Historical Count and the value 1st, then the view scrolls down to a line chart. The cursor hovers a data point, raising a value tooltip and a menu of actions.
Techniques: Cursor demo
Camera: Pan
A static analytics dashboard shows a blue line chart of weekly uniques across twelve weeks. A dark blue dropdown panel sits open over the right side, listing six actions with icons, while a mouse cursor hovers at the panel's right edge.
Camera: Static
A centered indigo sentence sits on a white card framed by a dotted quarter-circle, a dot grid, and a thin curve. The block holds still, then the word Ever. fades in pale gray and turns indigo.
On-screen text: “The new Historical Count property tracks behaviors by the 1st, 2nd, or 3rd time performed.”, “Ever.”
Camera: Static
A plain off-white card with faint lavender dot grids in the top corners and a thin wavy line along the bottom. A two-line indigo sentence sits centered, fading in from pale lavender to full color while the background shapes stay still.
On-screen text: “Not just by how many times the behavior happened last month.”
Camera: Static
A centered purple sentence sits on a white background, framed by corner dot grids, a soft quarter circle, and a thin wavy line. The text holds still, then clears to leave the empty decorated frame.
On-screen text: “Not just by how many times the behavior happened last month.”
Camera: Static
A white title card shows indigo text posing a sample question, framed by a lavender corner shape, dot grids and a thin wavy line. The frame holds still, then crossfades into a Pathfinder interface with a step bar and an explanatory text panel.
On-screen text: “Answer new questions like, “What paths did users take to make their first purchase?””
Camera: Static
A Mixpanel Pathfinder screen. A cursor clicks the 'starting with' dropdown and selects 'ending with'; the step badge jumps to 15 and the bar chart clears into a loading spinner as the view scrolls down to the bottom toolbar.
Techniques: Cursor demo, UI zoom
Camera: Static
Opens on a help note and a green Step 15 bar, then scrolls down to a user flow chart of colored columns joined by flow bands. The view zooms in and pans left to expose earlier steps as the cursor hovers near the Previous Step button.
Techniques: UI zoom, Cursor demo
Camera: Pan
A plain white background with faint purple geometric accents holds centered dark blue text reading “And even, 'What's driving users to their 2nd purchase?'”.
On-screen text: “And even,”, “What's driving users to their 2nd purchase?”
Camera: Static
A cursor clicks the where button on the second funnel step, opens a property menu, and sets Historical Count to 2nd. The view scrolls down to a two-bar chart, and the cursor hovers the second bar to surface a percentage tooltip.
Techniques: Cursor demo
Camera: Pan
A funnel analysis screen shows two blue bars on a white chart. A dark menu is open over the right bar, listing actions. The cursor glides down the list and stops on Investigate Conversion Drivers, which highlights in blue.
Techniques: Cursor demo
Camera: Static
A dimmed funnel dashboard shows a dark dropdown menu open over the bar chart while a cursor hovers on the highlighted “Investigate Conversion Drivers” row. A white side panel slides in from the right edge of the screen.
Techniques: Cursor demo
Camera: Static
A product analytics panel titled Conversion Drivers fills the frame; the view scrolls down to bring a correlation table of user events into view, then the whole screen fades to white.
Camera: Pan
A plain off-white frame holds a purple quarter-circle and dot grids in the corners with a thin wavy line below. A three-line indigo headline fades in at center, mixing regular and bold weights, then holds still.
On-screen text: “So you can iterate quickly,”, “and turn more new users into”, “high-value customers.”
Camera: Static
A white card with light-purple corner dots and a wavy line holds the Like MINDBODY lockup, which fades from pale to full color, then gives way to a centered indigo headline reading they use milestone analysis to guide users to their 5th workout, faster.
On-screen text: “Like MINDBODY”, “They use milestone analysis to guide users to their 5th workout, faster.”
Camera: Static
On a cream background with a purple corner shape and a dot grid, three centered indigo statements crossfade in turn, each holding still. The lines read as a sequence of product claims about milestone analysis.
On-screen text: “They use milestone analysis to guide users to their 5th workout, faster.”, “Build for growth with milestone analysis in Amplitude.”, “The 1st solution to deliver comprehensive insights on user milestones, at scale.”
Camera: Static
A pale lavender circle sits center on a white field with faint dot grids and a thin wavy line. The circle fills solid blue, a white waveform A appears inside, then it shifts left as the word Amplitude slides in to form the centered logo lockup, which holds.
On-screen text: “The 1st solution to deliver”, “comprehensive insights on”, “user milestones, at scale.”, “Amplitude”
Camera: Static