1:00


Shielded Live Demo
Shielded · B2B · Jul 2026
Backpack · Aug 2026 · 0:27 · AI-annotated
Backpack’s 0:27 launch film runs 14 scenes, about 1.9 s each. The product is on screen from the first frame and 2 features are revealed. There is no explicit call to action. The video is a short UI tour: a kinetic type intro, then consecutive interface shots where a cursor drives every action, with scale-in, blur and fade transitions between states. Its signature moves are the hover lift on ticker pills, the metric-cycling chart redraws, and the zoom-through on the Add Metric button, all held on a plain white field at a slow, steady pace.
Is this your launch? to your site or press kit.
On a plain white field, the bold black word “Introducing” snaps from a two-line split into one centered line, a brief motion echo trailing beneath it, then holds locked-off.
On-screen text: “Introducing”
Techniques: Kinetic type
Camera: Static
On a pale background, the bold word Introducing holds center, then crossfades into the larger word Graphs as a thin red graph line draws across its letters. The smaller caption on Backpack fades in beneath.
On-screen text: “Introducing”, “Graphs”, “on Backpack”
Techniques: Kinetic type
Camera: Static
A white title card shows the word Graphs in large black type with a thin pink line tracing through the letters like a graph, and a smaller on Backpack line beneath. The pink line retracts, then the whole text fades out to a blank white frame.
On-screen text: “Graphs”, “on Backpack”
Camera: Static
A grid of pill-shaped cards, each pairing a company logo with a stock ticker, fills a light background. A white arrow cursor glides down the grid, and the card beneath it lifts with a soft drop shadow on hover.
Techniques: Cursor demo
Camera: Static
A dense grid of white rounded stock ticker pills, each with a colored logo and symbol, fills the frame on a light gray background. A mouse cursor glides from the AMZN pill rightward to ABBV as the grid drifts slightly left.
Techniques: Cursor demo
Camera: Static
A white Main Monitor panel fills the frame. Its line chart cycles through metrics, the title switching from Historical Price to EPS to Price to Earnings Ratio as the four colored lines redraw and the axis labels shift from 2025 dates to 2023 to 2025.
Camera: Static
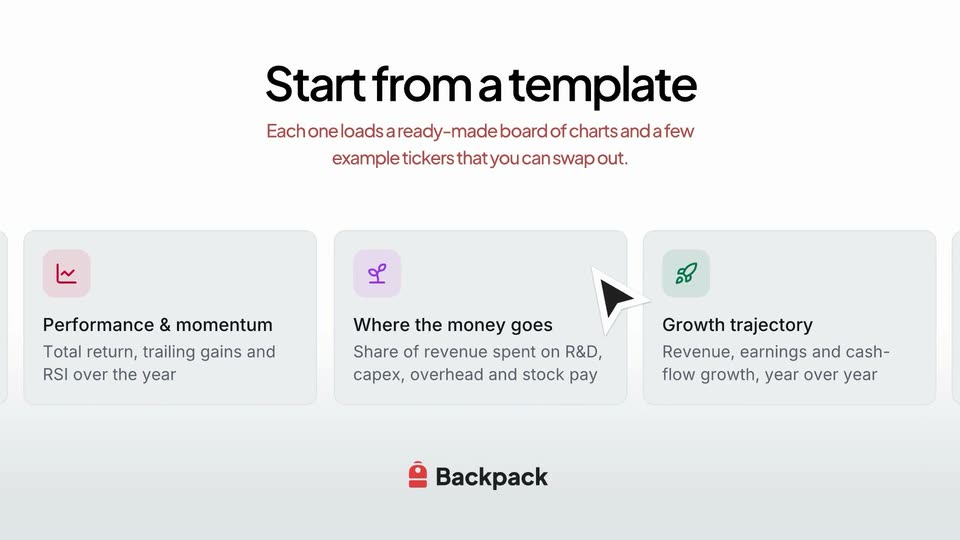
A white screen shows the black headline “Start from a template” and a red subtitle fading in above a row of light-grey template cards that scroll left in a loop. A cursor hovers over the middle card at the end, blurring the rest.
On-screen text: “Start from a template”, “Each one loads a ready-made board of charts and a few example tickers that you can swap out.”
Techniques: Cursor demo
Camera: Static
A near-blank light screen with a faint top tab bar and the red Backpack logo at the bottom fades into a full financial dashboard. The main area fills with four line-chart cards while a right sidebar lists tickers and metrics.
Camera: Static
A flat white dashboard shows four line charts in a two by two grid beside a sidebar of tickers and metrics. A white cursor arrow glides up from the lower right corner to rest on the Add Metric button.
Techniques: Cursor demo
Camera: Static
A rounded white button reading '+ Add Metric' sits centered on a pale background. A black arrow cursor glides in from the right and stops on the button, which fills solid gray. The label scales up slightly as the cursor lands.
Techniques: Cursor demo
Camera: Static
A light interface panel shows a search field above a categorized metrics list on the left and a results panel on the right. A large translucent Add Metric pill overlays the center and scales away, then a hand cursor hovers over two list rows.
On-screen text: “+ Add Metric”
Techniques: Cursor demo
Camera: Static
A light gray metrics browser fills the frame. A hand cursor hovers the Valuation row in the left category list, then jumps to the right list, highlighting Debt to Market Cap and Forward Price to Earnings Growth Ratio in turn. The hovered row darkens as it moves.
Techniques: Cursor demo
Camera: Static
A cursor hovers over the FQ Quarter row in the Debt to Market Cap panel and selects it, marking it with a blue check. The interface then scales up, pushing the search bar off the top edge while the selected row stays centered.
Techniques: Cursor demo, UI zoom
Camera: Static
A red backpack icon and the wordmark Backpack fade in at the center of a white background, hold briefly, then fade out to a blank frame.
On-screen text: “Backpack”
Camera: Static