0:39
Motionfly - Motion Graphics is super cooked. Just made this video with one promp
Motionfly · Oct 2026
Tracwell · Sep 2026 · 2:31 · AI-annotated
Tracwell’s 2:31 launch film runs 41 scenes, about 3.7 s each. The product is on screen from the first frame and 7 features are revealed. There is no explicit call to action. A cursor-led tour that first scrolls the Tracwell marketing site, then walks each app section in sidebar order from Overview to Settings. Its signature moves are eased page scrolls, skeleton loaders filling into live data, panels tilted in 3D over a blurred sunset street, and quick tab swaps with tooltips.
Is this your launch? to your site or press kit.
Motionfly · Oct 2026
Runway · AI · Oct 2026
A tilted 3D mockup of the Tracwell landing page floats over a blurred street photo. The page scrolls down, carrying the hero headline off the top and revealing the Acme dashboard with its stat cards, bar chart, and source lists.
Techniques: 3D mockup, UI zoom
Camera: Pan
A flat analytics dashboard, with bar charts and data tables, hovers over a blurred street backdrop. The panel slides upward, exposing a white section below where a small gray label and a large dark headline scroll into view. A text cursor rests mid-panel.
On-screen text: “How it Works”, “Go from first event”
Camera: Pan
A white product-interface card rises over a blurred mountain-deck photo, the hero headline fading out as the three feature panels and top navigation come into full view.
Camera: Static
The Tracwell features page scrolls down through two rows of three cards, showing a code snippet, event lists, line charts and a funnel. A white panel holds the interface over a blurred street backdrop, and a cursor drifts across the middle column.
Techniques: Cursor demo
Camera: Pan
A white product dashboard panel sits over a blurred outdoor backdrop. The dashboard's three columns scroll upward, then the panel fades to white as a small uppercase label and a large gray headline appear centered.
On-screen text: “PRODUCT WALKTHROUGH”, “See the answer. Then inspect the path behind it.”
Camera: Static
A flat Tracwell marketing page floats over a blurred live-action backdrop, its inner Journeys dashboard tilted in 3D with a cursor hovering on it. The page scrolls down, the dashboard flattens, and a second feature block with the left sidebar slides into view.
Techniques: 3D mockup, Parallax
Camera: Static
Over a blurred desktop wallpaper, the Tracwell website scrolls down in a fast eased motion: the revenue attribution table slides up, the Questions, answered. heading passes, and an FAQ accordion settles with the first item expanded. A mouse cursor rests in the center.
Techniques: Speed ramp
Camera: Static
A white webpage panel scrolls downward over a live-action street video, moving from an FAQ accordion list past a blue Get started banner to the footer, where a cursor hovers over the Pricing link.
Techniques: Cursor demo
Camera: Pan
A Tracwell pricing page shows three plan cards. A floating FAQ panel with one expanded answer fades out, the page scrolls down through the feature lists and back up, and the cursor glides to the Login button.
Techniques: Cursor demo
Camera: Static
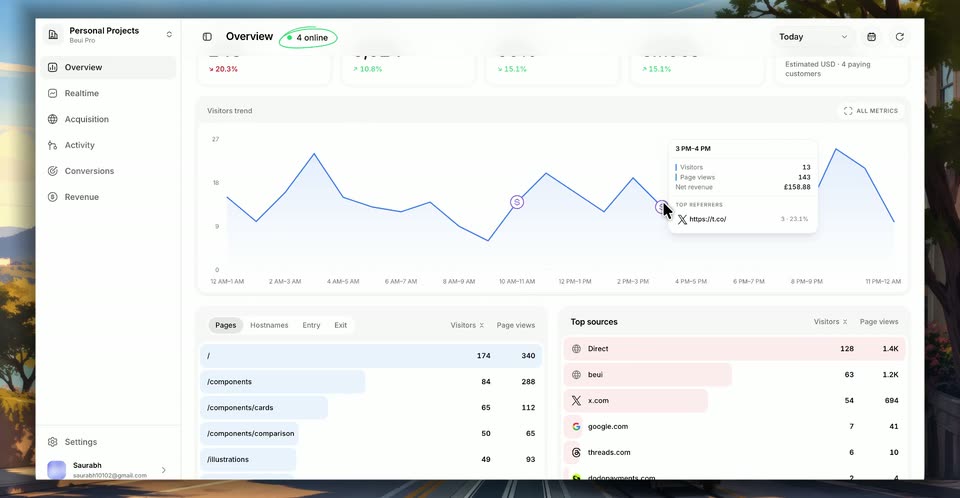
A tilted analytics dashboard floats over a 3D street scene. A cursor opens the date dropdown, switches from Last 7 days to Today, hovers the trend chart to pop up tooltips, then scrolls the page to reveal more data tables.
Techniques: 3D mockup, Cursor demo
Camera: Static
A flat analytics dashboard titled “Personal Projects” fills the frame over a blurred outdoor backdrop. A green hand-drawn circle highlights the “4 online” badge at the top, while a cursor hovers over the DETAILS control in the Pages panel.
Techniques: Cursor demo
Camera: Static
A centered 'Pages' analytics modal, listing paths with visitor and view counts, floats over a blurred 3D landscape as a cursor hovers a row. The white field around it clears to reveal the full dashboard, left nav and side cards.
Camera: Static
A light analytics dashboard with four data panels sits over a blurred outdoor background. A cursor glides from the pages table up to the Realtime item in the left sidebar.
Techniques: Cursor demo
Camera: Static
The Realtime dashboard loads from gray placeholders as visitor counters tick up and a dotted globe spins in the center. A cursor toggles the Country and Source tabs, scrolls to the live events table, and opens a page_view detail panel.
Techniques: Cursor demo
Camera: Static
A white page_view event panel sits over a blurred dashboard. The panel slides down to reveal the top navigation bar with the Tracewell logo, while a hand cursor drifts to the top right corner.
Techniques: Cursor demo
Camera: Static
A tilted 3D dashboard mockup floats over a blurred suburban backdrop. The view switches from a realtime globe and event list to an acquisition detail card, and a cursor hovers over rows to reveal a location tooltip.
Techniques: 3D mockup, Cursor demo
Camera: Static
A white event-detail panel for a page_view sits centered over a blurred warm-toned street photo. The left column lists summary fields and the right column lists visit context with a flag and browser icons. A mouse cursor drifts from the device row to the top edge.
Techniques: Cursor demo
Camera: Static
A white analytics dashboard floats over a blurred street photo. A dotted globe rotates and fills in above the Pause globe control, while the live events list refreshes and a country count panel appears on the right.
Camera: Static
A dashboard interface displays a rotating dotted globe in the center. A mouse cursor moves from the globe to the left sidebar, clicks the Acquisition menu item, and the view transitions to an empty table layout.
Techniques: Cursor demo
Camera: Static
A white analytics dashboard sits over a blurred outdoor photo. A cursor taps Acquisition in the sidebar, the table fills from gray placeholders with source names and counts, then scrolls down the list as the cursor hovers a row.
Techniques: Cursor demo
Camera: Static
A light analytics dashboard with a left sidebar and a sources table sits over a blurred outdoor backdrop. A cursor moves to the x.com row and clicks it, opening a detail card on the left with two empty chart panels. The table flickers briefly as the row re-renders.
Techniques: Cursor demo
Camera: Static
A white analytics modal sits over a blurred desktop photo. A cursor moves across the panel while the pages list scrolls and loads extra rows, then the view shifts down to reveal country, device and browser rows.
Techniques: Cursor demo
Camera: Static
A white analytics modal overlays a dark dashboard above a blurred outdoor backdrop. A cursor grabs the modal's top edge and drags it down, revealing the tabbed header behind and shifting the country, device and browser figures at the bottom.
Techniques: Cursor demo
Camera: Static
A tilted analytics dashboard floats over a blurred desk background. A cursor clicks through the Sources, Referrers and Campaigns tabs, each swap blurring the table rows, and a UTM referrer tooltip pops up at the end.
Techniques: 3D mockup, Cursor demo
Camera: Static
A white analytics panel floats over a blurred desktop background. Its header shows a tracked URL with UTM parameters. Stat cards and tables for pages, countries, devices and browsers load in, the right column scrolls through them, a blur wipe transitions the view, and a cursor hovers over rows.
Techniques: Cursor demo
Camera: Static
A flat analytics window sits over a blurred office backdrop. A cursor clicks the Pages tab, swapping the table from campaign URLs to page paths, then clicks Activity in the sidebar to open an events list and hovers down its rows.
Techniques: Cursor demo
Camera: Static
A white detail panel opens over a blurred analytics dashboard. Inside, the data view scrolls down through charts and tables of sources, properties and devices while a cursor hovers the line graph to pop a tooltip, then the panel dissolves back to the dashboard.
Techniques: Cursor demo
Camera: Static
A product analytics dashboard floats over a blurred outdoor backdrop, easing in with a subtle zoom. A cursor clicks the Visitors tab, swapping the events table for a visitor list, then hovers a row to raise a detail panel.
Techniques: UI zoom, Cursor demo
Camera: Static
Over a blurred street photo, a white visitor-detail card shows visitor context on the left and a scrollable page list on the right. A cursor scrolls the right-hand list through numbered page-view rows, then the card closes to expose the Activity table.
Techniques: Cursor demo
Camera: Static
A cursor clicks the Journeys tab in an analytics dashboard, the visitor table switches to a grid of journey cards, then the cursor taps a card and a detail panel slides in from the right showing the visit path and context.
Techniques: Cursor demo
Camera: Static
A white session-detail panel floats over a blurred desktop, showing a path, three stat cards and a nine-row timeline, while a cursor hovers the list. The panel then closes to reveal the full Activity screen with a left sidebar and a grid of visitor journey cards.
Techniques: Cursor demo
Camera: Static
A flat analytics dashboard, listing session journey cards under the Journeys tab, sits over a blurred street backdrop. A cursor glides in and hovers over the date filter at the top right.
Techniques: Cursor demo
Camera: Static
A session detail panel with stats and a timeline sits over a blurred desktop. A cursor moves to the close button and the panel slides away, revealing the Activity journeys grid of visitor cards behind it.
Techniques: Cursor demo
Camera: Static
A flat analytics dashboard floats over a blurred sunset road. A cursor clicks Conversions; skeleton cards load, then goal metrics and a blue trend line fill in. The cursor hovers the chart for a tooltip, switches to the Funnels tab, and hovers the funnel shape as its numbers appear.
Techniques: Cursor demo
Camera: Static
A light dashboard panel over a blurred street photo loads from gray skeleton blocks into a revenue view with stat cards and a visitor table. A cursor clicks a row, opening a purchasing journeys panel that expands to show a visit context sidebar.
Techniques: Cursor demo
Camera: Static
A session-detail panel sits over a blurred desktop. Its stat cards and timeline fill in as data loads, then a cursor grabs the top handle and drags the panel up off screen, dismissing it.
Techniques: Cursor demo
Camera: Static
A revenue dashboard shows a purchasing journeys table. A cursor moves down and clicks the Visitor 5349 row, opening a left panel that fades in with visit details, source, and device.
Techniques: Cursor demo
Camera: Static
A pale session-replay panel floats over a blurred window view. Its timeline list scrolls up past numbered page views while a cursor hovers the green Payment successful row, then drifts to the top edge.
Techniques: Cursor demo
Camera: Static
A flat analytics dashboard window floats over a blurred desk background. A cursor moves down the left sidebar, clicking Revenue to reveal a scrolling visitor list, then Settings, as the content panels slide horizontally between pages.
Techniques: Cursor demo
Camera: Static
A settings page of a web app floats over a 3D sunset landscape. A cursor moves from the sidebar toward the theme row and clicks Dark, switching the whole interface to a dark color scheme.
Techniques: Cursor demo
Camera: Static
A dark settings panel of a web analytics app floats over a blurred sunset road. A cursor moves along the top tabs, clicking Website then Team, and the right-hand content swaps to each section, the Team view flashing a skeleton loader before filling in.
Techniques: Cursor demo
Camera: Static