1:10

Introducing workspace agents in ChatGPT
OpenAI · AI · Apr 2026
Ramp · Sep 2026 · 0:54 · AI-annotated
A benchmark launch video built as a quiet, slide-like sequence on a flat cream field, where a vintage calculator prints paper slips to reveal the scope (22 companies, 137 tasks, expert rubrics) and then a series of muted data charts (scatter, grouped and stacked bars) animate in one titled section at a time. The pacing is slow and even, with crossfades instead of cuts, left-aligned headline blocks holding while the right side animates, and a soft fade to a centered title and URL closes it.
OpenAI · AI · Apr 2026
Replit · Developer tools · Dec 2025
Anthropic · AI · Jan 2026
On a plain cream background, the small caps label INTRODUCING and the large title Ramp Accounting Bench fade in at top center, deepening from gray to black. A vintage black adding machine fades in below the title, centered.
On-screen text: “INTRODUCING”, “Ramp Accounting Bench”
Camera: Static
A vintage black adding machine sits centered over a beige circular dial on a cream background. A clay tablet, a coin, a keyboard and a small robotic hand pop in one by one around it. The title stays locked at the top.
On-screen text: “INTRODUCING”, “Ramp Accounting Bench”
Camera: Static
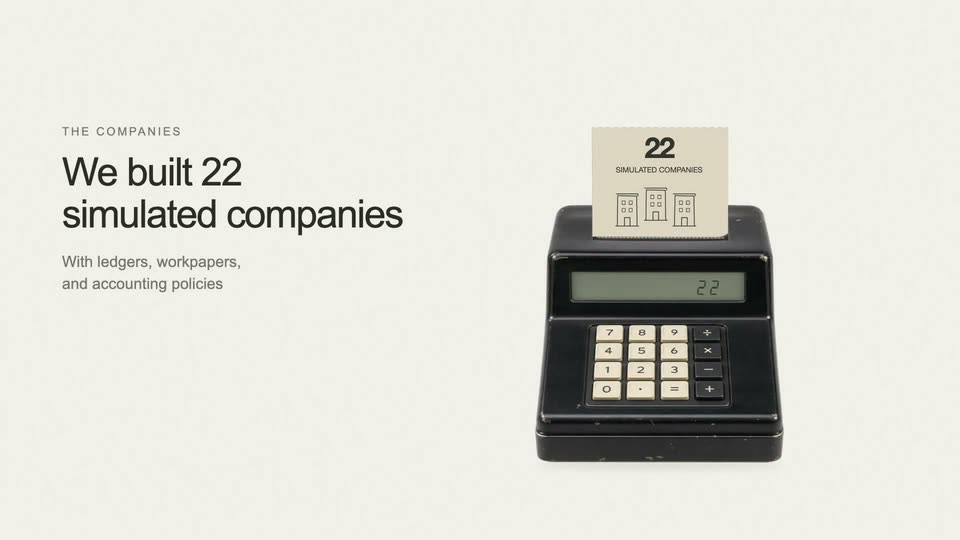
A black adding machine on a cream field ticks its display to 22 while a paper tape printing 22 SIMULATED COMPANIES and three building icons rises from the slot. The left-side headline block fades in, holds, then fades out.
On-screen text: “THE COMPANIES”, “We built 22 simulated companies”, “With ledgers, workpapers, and accounting policies”
Camera: Static
A black desktop calculator sits on a cream field while illustrated paper slips print into its slot, tilt and drop to the base. The left headline swaps from 'And created 137 accounting tasks' to 'Rubrics written by accounting professionals'.
On-screen text: “THE TASKS”, “And created 137 accounting tasks”, “Reconcile balances, calculate reserves, and propose adjusting entries”, “22 SIMULATED COMPANIES”, “137 ACCOUNTING TASKS”, “THE RUBRICS”, “Rubrics written by accounting professionals”, “Each task is evaluated against expert-defined criteria”, “EXPERT-WRITTEN RUBRICS”
Techniques: 3D mockup
Camera: Static
A black printing calculator sits at a three-quarter angle on a cream background, paper tape labels poking from its sides. On the left, a gray headline cross-fades from a rubric line to an example task block with a small uppercase label.
On-screen text: “Rubrics written by accounting professionals”, “EXAMPLE TASK”, “Review the allowance for doubtful accounts”, “Compare the FY2024 workpaper, QuickBooks ledger and reserve policy”, “Consulted company: Receivables department”
Techniques: Kinetic type
Camera: Static
A black desktop calculator sits at a slight angle on a plain off-white field, with a static headline block on the left. A paper tape rolls up from the top, scrolling lines of agent-run text, while the LCD counter ticks from 01 to 05.
On-screen text: “EXAMPLE TASK”, “Review the allowance for doubtful accounts”, “Compare the FY2024 workpaper, QuickBooks ledger and reserve policy”, “Simulated company · Recorded agent run”
Techniques: 3D mockup
Camera: Static
A faint 3D calculator with a paper task card crossfades to white while a benchmark chart fades in. The chart carries the title Model performance., a Mean reward vs. cost subtitle, and empty percentage and dollar axes with a dashed Pareto frontier legend; no data points are plotted.
On-screen text: “Model performance.”, “Mean reward vs. cost”, “18 models · 137 tasks”, “Pareto frontier”, “Mean reward (%)”, “Observed mean cost per measured token (USD)”
Camera: Static
A scatter plot titled Model performance settles in on a cream grid, points labeled with model names. A dashed Pareto frontier line draws left to right across the top cluster, then the chart pans right to reveal a large 49.7% stat on the left.
On-screen text: “Model performance.”, “Mean reward vs. cost”, “49.7%”, “Highest mean reward”, “Claude Fable 5.1”
Camera: Pull out
A light gray scatter plot of model logos fades in across a cost versus accuracy grid. On the left, a large 21.2 percent stat block and the title Model accuracy fade from transparent to solid. A dashed Pareto frontier line traces the upper edge of the points.
On-screen text: “Model accuracy”, “At least one correct attempt out of three”, “21.2%”, “Highest Pass@3”, “29 of 137 tasks”, “GLM-5.3”
Camera: Static
A static infographic on a light background shows a scatter plot of model accuracy versus cost, with a dashed Pareto frontier line and a large 21.2% stat on the left. The frame holds, then fades to white at the end.
On-screen text: “Model accuracy”, “At least one correct attempt out of three”, “18 models · 137 tasks”, “21.2%”, “Highest Pass@3”, “29 of 137 tasks”, “GLM-5.3”
Camera: Static
On a cream background, the dark title 'How models compare' fades in above a bar chart. Five groups of four muted-colored bars then grow up from the baseline, value labels appearing on top, while the legend and axis categories remain static.
On-screen text: “How models compare”, “Mean reward by task type · four selected models”
Camera: Static
A faded grouped bar chart titled How models compare crossfades into a horizontal bar chart titled Common mistakes, whose four rows appear top to bottom while the last row is still fading in.
On-screen text: “How models compare”, “Mean reward by task type · four selected models”, “Common mistakes”, “Five accounting-error categories · all 18 models”, “Percentages cover the five error types shown.”
Camera: Static
On a cream background, a horizontal bar chart of five error categories grows in, then morphs into a stacked bar chart comparing four models, each row split into five colored segments with a legend below.
On-screen text: “Common mistakes”, “Five accounting-error categories · all 18 models”, “Failure mix among four benchmark contenders”
Techniques: Morph
Camera: Static
A benchmark bar chart listing four AI models dissolves out on a cream background as the gray title Ramp Accounting Bench fades in at center.
On-screen text: “Ramp Accounting Bench”
Camera: Static
A locked-off end card on a pale cream background. The dark gray title sits centered, with a smaller light gray URL fading in just beneath it. No motion beyond the soft fade.
On-screen text: “Ramp Accounting Bench”, “labs.ramp.com/ramp-accounting-bench”
Camera: Static
A light beige end card shows a centered black logo mark with a gray title above and a smaller URL below; the text fades out, leaving the logo alone.
On-screen text: “Ramp Accounting Bench”, “labs.ramp.com/ramp-accounting-bench”
Camera: Static